Unlocking Data Quality with PySpark and Deequ Insights
Written on
Chapter 1: Introduction to Data Quality Checks
In today's world, we often hear concerns from colleagues, stakeholders, and even clients regarding the integrity of our data. Instead of waiting for feedback, imagine if we could proactively implement checks and constraints to spot issues before they reach our data consumers, even for our most substantial datasets. That’s the purpose of this discussion.
Deequ is a powerful tool that performs checks and sets constraints to uncover problems within datasets. I will demonstrate its capabilities using Google Colab alongside an Integrated Public-Use Microdata Series (IPUMS) dataset. I've included a sample dataset and code for you to follow along.
What is Deequ?
Deequ is an open-source framework developed primarily for AWS. It facilitates the creation of data quality tests to highlight unexpected values in our datasets. You can run these tests on either a pandas DataFrame or a Spark DataFrame.
Deequ consists of four main components:
- Metrics computation
- Constraint suggestion
- Constraint verification
- Metrics repository
By employing these techniques, you can confidently affirm that your data meets expected standards.
Curious about the spelling of Deequ? The abbreviation for data quality is DQ, and when pronounced, it sounds like "dequeue," which perfectly captures its essence!
Understanding the IPUMS Dataset
In the provided repository, you will find two datasets: one containing sample data and the other providing the necessary mapping to convert extract codes into actual names. These datasets derive from IPUMS, which includes a variety of information such as individual income, incarceration likelihood, and age. Other survey questions cover aspects like employment earnings, parental education, occupation type, and household income sources. Each record in this dataset represents an individual, detailing their date of birth, gender, and parental education level.
If you're interested in fetching this data yourself, follow the instructions below. Alternatively, the df_30.csv.zip file is available, showing the initial columns below.
Fetching the Data Yourself
To obtain data directly, visit the IPUMS USA website:
IPUMS USA: vars by group
Harmonized variables are consistently coded across census years. Source variables are the unrecoded variables unique to…
usa.ipums.org
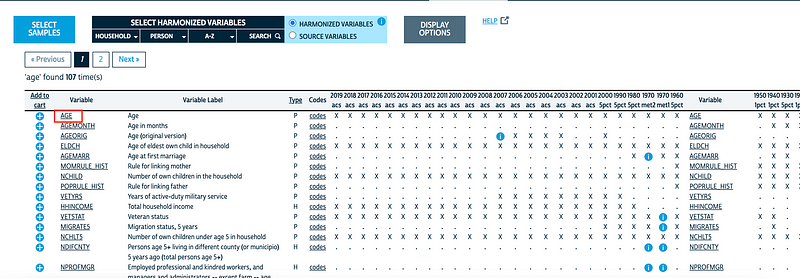
Searching for a variable like "age" is straightforward. When you search for "age," you'll be directed to a relevant page.

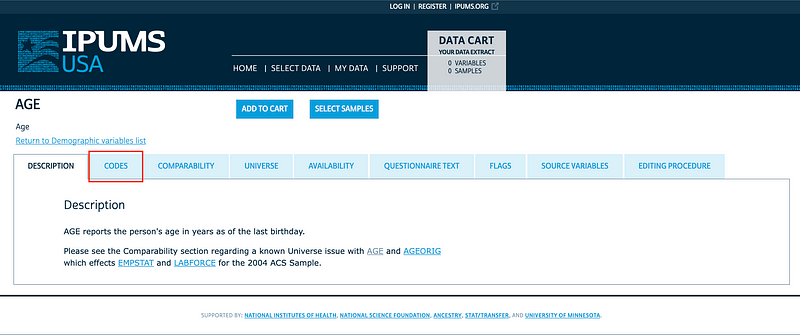
After adding it to your cart, you'll need to save the code mapping to the variable name. Clicking on the variable will load a new page.

Click on "codes" and save this data externally. Each variable will have a corresponding code, e.g., gender is represented by 0 for female and 1 for male. The mapping of code to value data will also be necessary for analysis.
Installing PySpark and PyDeequ
Before running PyDeequ, you need to install PySpark:
!apt-get install openjdk-11-jdk-headless -qq > /dev/null
!tar xf spark-3.0.3-bin-hadoop2.7.tgz
!pip install -q findspark
Next, configure the environment variables for PySpark:
import os
os.environ["JAVA_HOME"] = "/usr/lib/jvm/java-11-openjdk-amd64"
os.environ["SPARK_HOME"] = "/content/spark-3.0.3-bin-hadoop2.7"
Since I am using Google Colab, I need to initialize Spark with the following:
import findspark
findspark.init()
Finally, install PyDeequ:
!pip install pydeequ
Now, set up the Spark session with PyDeequ:
from pyspark.sql import SparkSession, Row
import pydeequ
spark = (SparkSession
.builder
.config("spark.jars.packages", pydeequ.deequ_maven_coord)
.config("spark.jars.excludes", pydeequ.f2j_maven_coord)
.getOrCreate())
With that, you are ready to proceed.
Reading the Dataset
Ensure your dataset file, whether it’s your own or the sample provided, is unzipped and accessible.
df = spark.read.option("header", "true").csv('<your path>/df_30.csv')
My dataset contains numerous columns, but I want to focus on specific ones. I renamed the “SEX_NAME” column to gender and “OCC2010_NAME” to occupation:
df = df.select(['YEAR', 'REGION', 'DENSITY', 'CNTRY', 'NCOUPLES', 'gender', 'AGE', 'EDUCD_NAME', 'occupation', 'DEGFIELD_NAME'])
Now, let’s assess the data quality of this dataset.
Metrics Computation
In this section, we calculate metrics using functions found in the analyzers submodule. PyDeequ allows you to compute metrics in two ways:
- Run individual metrics:
from pydeequ.analyzers import AnalysisRunner, AnalyzerContext, ApproxCountDistinct, Completeness, Compliance, Mean, Size
analysisResult = AnalysisRunner(spark)
.onData(df)
.addAnalyzer(Size())
.addAnalyzer(Completeness("AGE"))
.addAnalyzer(ApproxCountDistinct("AGE"))
.addAnalyzer(Mean("AGE"))
.addAnalyzer(Compliance("AGE", "AGE > 0"))
.run()
Here, I've calculated the dataset size, checked for values in the age column, counted distinct values, calculated the average age, and ensured that the age column contains only positive values.
Now, let’s print the results as a DataFrame:
analysisResult_df = AnalyzerContext.successMetricsAsDataFrame(spark, analysisResult)
analysisResult_df.show()
This will display a table summarizing the metrics.
- Run a profile of the dataset:
from pydeequ.profiles import ColumnProfilerRunner
result = ColumnProfilerRunner(spark)
.onData(df)
.run()
To print the values:
for col, profile in result.profiles.items():
print(f'Column '{col}'')
print('t', f'completeness: {profile.completeness}')
print('t', f'approximate number of distinct values: {profile.approximateNumDistinctValues}')
print('t', f'datatype: {profile.dataType}')
These profiling results provide insights into the completeness and types of each column.
Constraint Suggestion
Identifying constraints can be challenging, but this component simplifies the process. If you’re unsure what constraints to apply, this feature will suggest a list of constraints for validation.
from pydeequ.suggestions import ConstraintSuggestionRunner, DEFAULT
suggestionResult = ConstraintSuggestionRunner(spark)
.onData(df)
.addConstraintRule(DEFAULT())
.run()
You can print the constraint suggestions as follows:
for sugg in suggestionResult['constraint_suggestions']:
print(f"Constraint suggestion for '{sugg['column_name']}': {sugg['description']}")
print(f"The corresponding Python code is: {sugg['code_for_constraint']}n")
This will show you the suggested constraints for various columns in your dataset.
Constraint Verification
After obtaining suggestions, you can verify the constraints against your dataset. First, initialize the Check class to set the desired logging level.
from pydeequ.checks import Check, CheckLevel, ConstrainableDataTypes
from pydeequ.verification import VerificationResult, VerificationSuite
check = Check(spark, CheckLevel.Warning, "Review Check")
Set up the constraints and execute the command:
checkResult = VerificationSuite(spark)
.onData(df)
.addCheck(
check.hasDataType("AGE", ConstrainableDataTypes.Integral)
.hasMin("AGE", lambda x: x == 0)
.isNonNegative("AGE")
.isComplete("AGE")
)
.run()
Display the results as a Spark DataFrame:
checkResult_df = VerificationResult.checkResultsAsDataFrame(spark, checkResult)
checkResult_df.show(truncate=False)
Metrics Repository
You can save the results of your calculations in a metrics repository for future comparisons. Initialize the metrics repository, either in-memory or on a filesystem. I used a JSON file named metrics.json:
from pydeequ.repository import FileSystemMetricsRepository, ResultKey
from pydeequ.analyzers import AnalysisRunner, ApproxCountDistinct
metrics_file = FileSystemMetricsRepository.helper_metrics_file(spark, 'metrics.json')
repository = FileSystemMetricsRepository(spark, metrics_file)
Now that the repository is set up, start your first calculation:
key_tags = {'tag': 'Age'}
resultKey = ResultKey(spark, ResultKey.current_milli_time(), key_tags)
analysisResult = AnalysisRunner(spark)
.onData(df)
.addAnalyzer(ApproxCountDistinct('AGE'))
.useRepository(repository)
.saveOrAppendResult(resultKey)
.run()
This will create the first entry in your repository.
To add a second value, read in a different dataset and create a new result key:
resultKey2 = ResultKey(spark, ResultKey.current_milli_time(), key_tags)
Load all the values from the metrics repository:
analysisResult_metRep = repository.load()
.before(ResultKey.current_milli_time())
.getSuccessMetricsAsDataFrame()
analysisResult_metRep.show()
Monitoring historical values can help you understand how your data evolves over time.
Conclusions
This overview outlined the functionalities of Deequ. By integrating Deequ with orchestrators like Airflow, you can receive alerts and gain valuable insights into your extensive datasets.
No more unsolicited feedback about data quality; you’ll have concrete evidence of its state. This approach is applicable not only to current datasets but also to future data.
I would love to hear how you’ve implemented these strategies. Feel free to share your experiences in the comments or connect with me on LinkedIn. Thank you for reading!
The first video, "Data Quality With or Without Apache Spark and Its Ecosystem," dives into the nuances of maintaining data quality using various tools, including Apache Spark.
The second video, "Building Data Quality Pipelines with Apache Spark and Delta Lake," explores how to create robust data quality pipelines to ensure the integrity of your data.