Mastering Groupby and Aggregate Functions in Pandas
Written on
Chapter 1: Introduction to Pandas Groupby and Aggregate
Pandas is an incredibly powerful library for data manipulation and analysis within Python. A prominent feature it offers is the ability to group data and conduct operations on those grouped datasets. In this article, we will explore how to effectively utilize the groupby and aggregate functions in Pandas for organizing data and executing operations.
To start, let's create a straightforward DataFrame:
import pandas as pd
data = {'name': ['Alice', 'Bob', 'Charlie', 'David', 'Eve'],
'age': [25, 40, 35, 40, 45],
'city': ['Phoenix', 'Chicago', 'Phoenix', 'Chicago', 'Phoenix']}
df = pd.DataFrame(data)
df
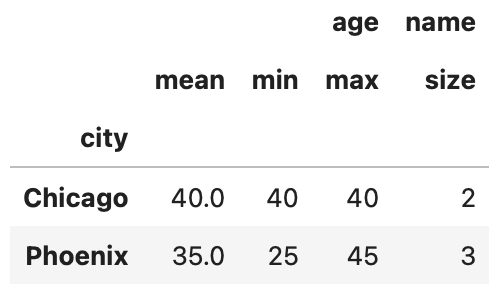
Now, suppose we wish to group the data by the 'city' column and calculate the average age of individuals in each city. We can achieve this using the groupby function in conjunction with the aggregate function to find the mean age for each group.
grouped = df.groupby('city')
result = grouped['age'].mean()
result
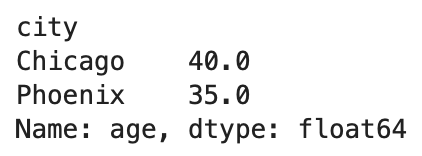
The output will present a new DataFrame containing the average age for each city:
Chapter 2: Advanced Aggregation Techniques
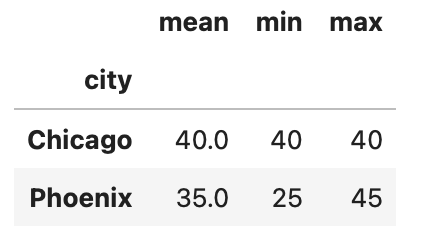
We can also apply multiple aggregation functions simultaneously. For instance, if we want to determine the mean, minimum, and maximum age for each city, we can do the following:
result = grouped['age'].agg(['mean', 'min', 'max'])
result
This will yield a new DataFrame featuring the mean, minimum, and maximum ages for every city:
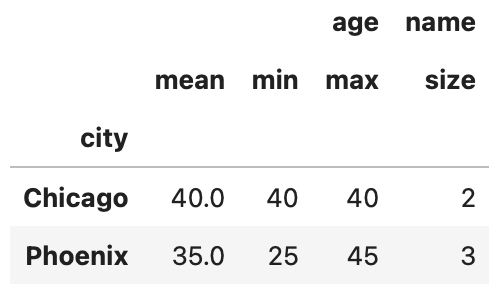
Furthermore, custom aggregation functions can be incorporated. For example, to ascertain the number of individuals in each city, we can utilize the 'size' function:
result = grouped.agg({'age': ['mean', 'min', 'max'], 'name': 'size'})
result
This will yield a DataFrame that includes the mean, minimum, and maximum ages, along with the total count of individuals per city.
Chapter 3: Grouping by Multiple Columns
Additionally, we can group by multiple columns by supplying a list of column names to the groupby function:
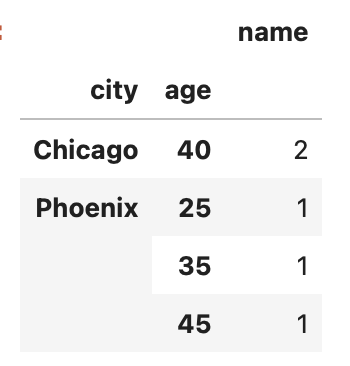
result = df.groupby(['city', 'age']).agg({'name': 'size'})
result
This command will group the data based on both the 'city' and 'age' columns, providing the count of names for each group.
In conclusion, the groupby and aggregate functions in Pandas are invaluable for data manipulation and analysis, allowing for easy grouping and operations on datasets, which facilitates extracting insights from extensive data collections.
For further learning, check these videos:
Advanced Aggregate Functions in SQL (GROUP BY, HAVING vs. WHERE)
This video dives into SQL's aggregate functions and their nuances.
Advanced Use of groupby(), aggregate, filter, transform, apply
This video provides a beginner-friendly tutorial on advanced groupby techniques in Pandas.
Chapter 4: Custom Aggregation Functions
- Custom Aggregation Functions: The aggregate function can accept a custom function, enabling diverse operations on the groups. For instance:
def custom_agg(x):
return x.sum() - x.mean()
df.groupby('city')['age'].agg(custom_agg)

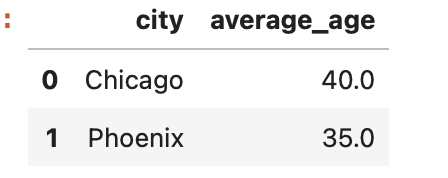
- Renaming Columns: You can modify the column names of the resulting DataFrame using the 'rename' function:
df.groupby('city')['age'].mean().reset_index().rename(columns={'age': 'average_age'})
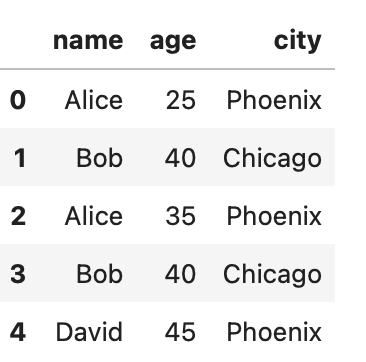
- Grouping by Multiple Levels: You can group by multiple levels using a list of columns, which is particularly useful for multi-index DataFrames:
data = {'name': ['Alice', 'Bob', 'Alice', 'Bob', 'David'],
'age': [25, 40, 35, 40, 45],
'city': ['Phoenix', 'Chicago', 'Phoenix', 'Chicago', 'Phoenix']}
df = pd.DataFrame(data)
df.set_index(['city', 'name']).groupby(level=['city', 'name']).mean()
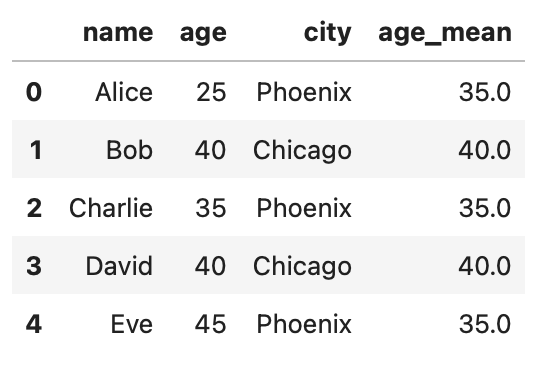
- Using Transform Function: The 'transform' function applies a function to a group and returns an object of the same shape as the original DataFrame, which is useful for adding computed values:
df['age_mean'] = df.groupby('city')['age'].transform('mean')
df
The versatility of groupby and aggregate functions in Pandas allows for myriad methods to manipulate and analyze data effectively.