Discover Loki: A Scalable Solution for Modern Log Management
Written on
Chapter 1: Understanding Log Aggregation
In today's cloud-native architecture, effective log aggregation is crucial. The traditional logging methods used in on-premises virtual machine environments are no longer applicable. For those interested, I previously discussed this topic in another post that I recommend checking out, but let’s focus on our current subject.
Section 1.1: The Necessity of Log Aggregation Today
Log aggregation has evolved from being a mere commodity to a vital component of containerized platforms.
Elasticsearch and its derivatives, such as the ELK and EFK stacks, have risen in popularity in recent years. They have become the go-to open-source solutions for log aggregation, widely adopted by major cloud providers, including Amazon's Elasticsearch Service. However, Elasticsearch has its limitations. If you’ve worked with it, you’re likely aware of the challenges. Despite its impressive search and indexing capabilities, issues such as storage utilization and the complex architecture involving various node types (master, data, ingester) can complicate implementations, particularly for smaller-scale needs.
This brings us to our main focus today: Loki, also known as Grafana Loki.

Grafana Loki is a logging management system developed as part of the Grafana project, designed with a distinct approach compared to Elasticsearch. Loki is a horizontally scalable, highly available, and multi-tenant log aggregation system inspired by Prometheus. It aims to be budget-friendly and straightforward to manage. Instead of indexing the log content, it utilizes a set of labels for each log stream.
This innovative approach addresses common issues faced by ELK users: it is cost-efficient and easy to use. Unlike ELK, where a complete index of event payloads is created, Loki focuses on defining labels for each log stream, drawing inspiration from Prometheus. This methodology allows log traces to be treated as metrics, enhancing our monitoring capabilities.
Section 1.2: Getting Started with Loki
When exploring a new technology like Loki, a fundamental question arises: How can I install it?
Loki is available in various formats to suit your deployment needs:
- SaaS: Offered as part of Grafana Cloud hosting solutions.
- On-Premises: Available as a standard binary for local installation.
- Cloud: Provided as a Docker image or Helm Chart for deployment in Kubernetes environments.
Additionally, Grafana Labs offers enterprise support for Loki for those who want to implement it in production. The project is open-source, licensed under the Apache License 2.0, allowing you to review and contribute to the code.
Chapter 2: Loki's Architecture and Functionality

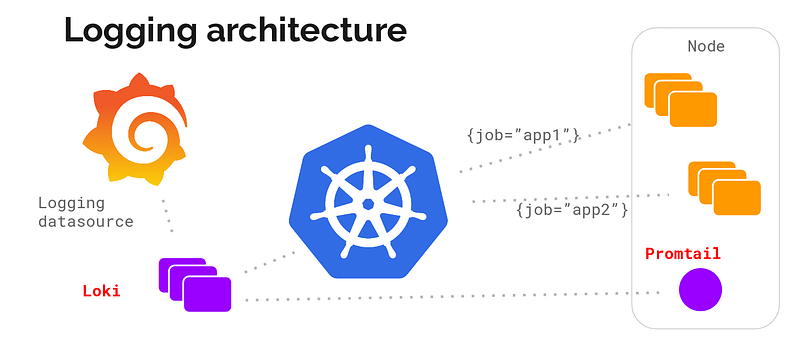
Loki's architecture resembles that of the ELK/EFK stack, employing a similar structure of "collectors" and "indexers." Loki serves as the central node responsible for storing log traces and their associated labels, providing an API for searching through them using LogQL, a query language akin to PromQL from Prometheus.
Promtail acts as the edge agent, gathering log traces from machines either on-premises or in a Kubernetes cluster. It serves a similar function to Logstash, Fluent-bit, or Fluentd within the ELK/EFK stack, offering plugins for filtering and transforming log data. Notably, Promtail can also convert log traces into Prometheus metrics, making them accessible for scraping by your Prometheus server.
Grafana serves as the user interface for the entire system, comparable to Kibana in the ELK/EFK stack. It provides seamless integration with Loki as a data source, facilitating trace exploration and inclusion in dashboards.
The video titled "How we reduced logs costs by moving from Elasticsearch to Grafana Loki" by Igor Latkin (KTS) discusses the cost benefits of transitioning to Loki for log management.
Summary
Grafana Loki presents an excellent solution for modern logging architectures, addressing two critical aspects: it offers a lightweight log aggregation option while enabling log traces to serve as a source for metrics. This functionality allows for the creation of detailed, business-oriented metrics that can be integrated into your dashboards and monitoring systems.