Estimating Pi Through a Needle-Dropping Experiment
Written on
Chapter 1: Introduction to the Needle-Dropping Experiment
Have you ever wondered how we can estimate Pi by simply dropping needles onto a piece of paper? This intriguing method involves a lined sheet of paper where the lines are spaced d mm apart. If we have a needle measuring t mm in length, and it is shorter than the distance between the lines, we can calculate the probability of the needle landing on a line when dropped randomly. Surprisingly, this probability is given by the formula 2t/(d).
But where does this result come from? And how can this needle-dropping technique be applied to estimate Pi?
Let's first delve into how this probability is derived. If you're not interested in the mathematical details, feel free to skip ahead to the section on estimating Pi.
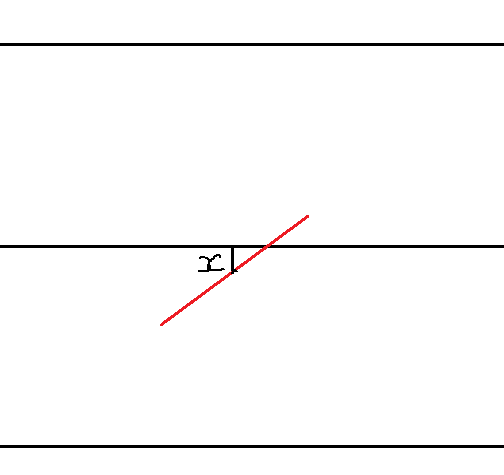
To begin, we define the distance from the center of the needle to the nearest line as x:
Next, we denote the angle the needle makes with the line as θ:
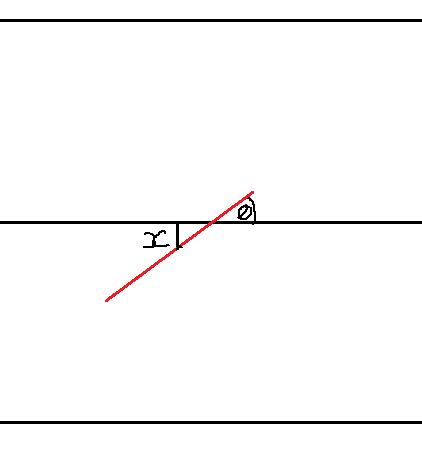
This angle θ ranges from 0 to π/2, since any angle greater than 90 degrees can be represented as an angle less than 90 degrees on the opposite side. Meanwhile, x ranges from 0 to d/2, where it is farthest from the line when the center is in between the lines (distance d/2) and closest when it is directly on the line. Therefore, we can uniformly model the probabilities of θ and x as follows:

The factor of 2/d arises because the distribution is uniform; thus, the probability can be expressed as 1/(d/2) = 2/d. We apply a similar analysis for θ:

Notably, the center position does not depend on the angle, and vice versa. Hence, these two variables are independent, allowing us to establish a joint probability distribution:

Next, we want to determine the probability that the needle actually crosses a line. Assuming we fix x and θ, we can visualize this with a triangle:
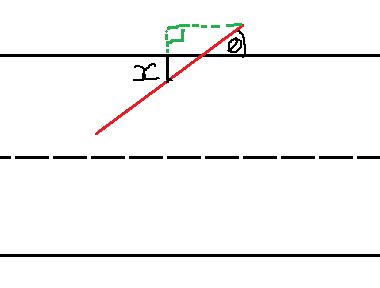
Using basic trigonometric identities, we can simplify this further:
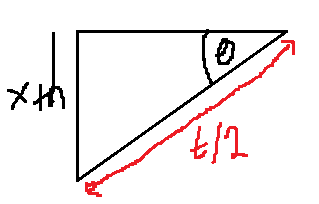
Here, h is a positive value, and t represents the needle's length. The distance from the center to either endpoint is t/2. As long as h is greater than zero, we require that this condition holds true. Thus, we derive a new limit:
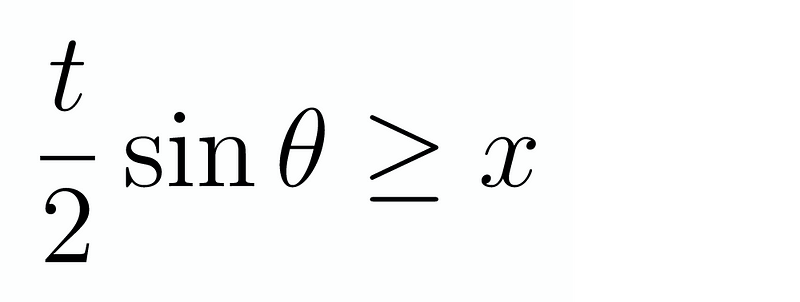
Now, we can vary θ and x to obtain the double integral:
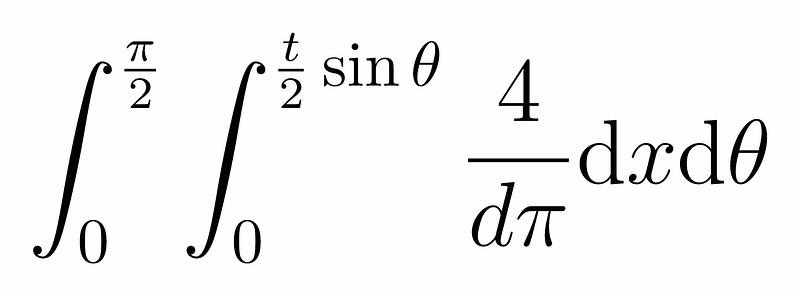
Assuming the needle length is less than or equal to the line spacing, we evaluate these integrals:
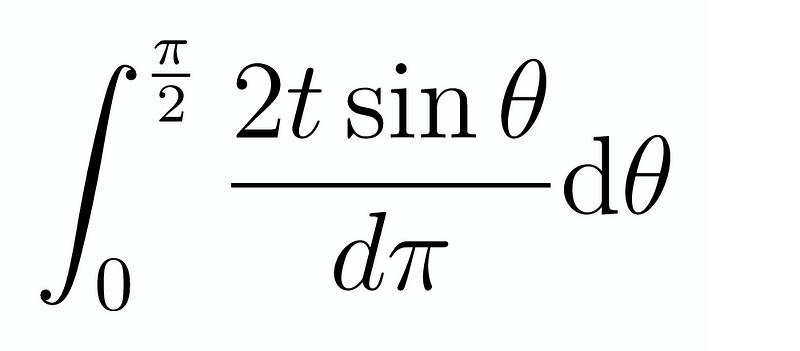
This leads us to the conclusion:
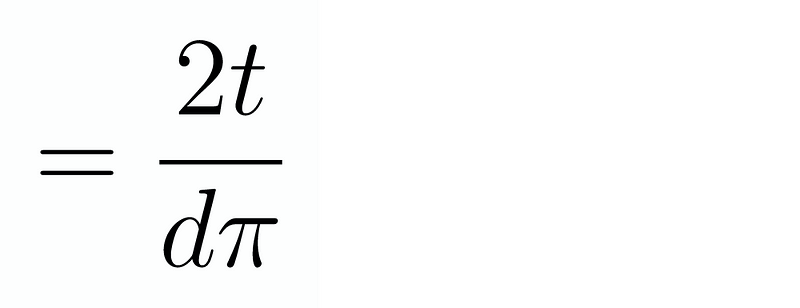
So, how can we leverage this to estimate Pi? The probability of a needle crossing a line relates to Pi. If we denote this probability as p, we can rearrange our earlier findings:

Now, how do we estimate p? Let's simulate dropping 10 needles:

In this case, the needles are the same length as the spacing, making t/d = 1. Thus, we can calculate Pi as 2/p. If 5 needles land on a line, we estimate the probability p as 5/10 = 1/2, leading to an estimate of Pi being 2/(1/2) = 4. While this is a rough estimate, increasing the number of needles yields better approximations.
Now, consider dropping 100 needles:

Instead of counting, I'll mention that 58 needles crossed a line, giving us an approximation of Pi as 2/(58/100) = 200/58, which is about 3.448. Though still not perfect, it's a significant improvement over 4.
In theory, if we continued this process indefinitely, we would arrive at a precise value of Pi. So, if you have some free time, why not try your hand at this fascinating experiment?
Chapter 2: Exploring the Videos
To further understand Buffon's Needle Problem and its implications, you can watch the following videos.
The first video titled "DETERMINE PI WITH THROWING NEEDLES ONTO A PAPER?!?" provides an engaging overview of the concept:
The second video, "Calculating Pi Experimentally (Buffon's Needle Problem)," dives deeper into the experimental aspects of estimating Pi:
References:
- Buffon’s Needle Problem - Wikipedia
- Needle Throwing Simulation